Optimizing Centrifugal Compressor Performance
This article presents a diagnostic analysis revealing that a new centrifugal compressor underperforms due to misaligned operation—not equipment fault. Replotting vendor curves highlights excessive flow, inadequate pressure, and motor overload. Targeted corrections improve efficiency and reliability.

The Role of Performance Curves in Operational Diagnostics
Written by Ketut Kumajaya | August 6, 2025
Introduction
Centrifugal compressors are widely utilized in industrial processes, such as air separation units (ASUs), for their ability to deliver continuous airflow with relatively high efficiency. However, even when new and compliant with design specifications, compressors can fail to meet expected discharge pressure or flow rates, leading to inefficiencies, increased energy costs, and potential downstream disruptions.
This article, based on a real-world case study, examines how performance curves serve as a critical diagnostic tool to evaluate operational performance, identify misalignments, and guide corrective actions.
Case Study: Compressor Failing to Meet Target Pressure
In an ASU, a newly installed three-stage centrifugal compressor was designed to deliver a flow rate of 12,767 Nm³/h, a discharge pressure of 680 kPa abs, and a shaft power of 1,090 kW. The compressor was powered by a 1,120 kW motor with 95.9% efficiency, providing an actual shaft power of 1,074.1 kW. Despite being new, field observations revealed that:
- Inlet Guide Vanes (IGV) were fully open at 100% to maximize flow capacity.
- Discharge pressure consistently fell short of the target, achieving only 601.3 kPa abs.
- Flow rate reached 12,958 Nm³/h, exceeding design specifications.
- Motor current readings were inconsistent: 77 A at the local panel versus 97 A at the main panel.
IGVs are adjustable vanes that regulate inlet air to the impeller, controlling compressor capacity and influencing flow and pressure characteristics. The discrepancies prompted a critical question: Was the compressor defective, or were operational parameters misaligned with system requirements?
Approach: Re-evaluating Performance Curves
To address this, we digitized the vendor’s performance curves using WebPlotDigitizer and visualized them with Python, mapping flow rate (Nm³/h) against discharge pressure (kPa abs) and shaft power (kW) for IGV settings of 20%, 40%, 60%, 80%, and 100%. The objectives were:
- Determine the actual operating condition relative to the design point.
- Assess whether the compressor operated within the optimal efficiency zone.
- Identify potential overcapacity or misalignment with process needs.
- Verify whether excessive IGV opening contributes to underperformance.
- Pinpoint risk levels tied to motor loading and zone deviation.
Findings from Performance Curves
The re-plotted performance curves provided critical insights:
- IGV 100%: At 601.3 kPa abs, the flow rate reached 12,958 Nm³/h, to the right of the design point (12,767 Nm³/h, 680 kPa abs), indicating excessive flow but insufficient pressure. Power consumption reached 1,084.38 kW, exceeding the motor’s actual shaft power of 1,074.1 kW.
- IGV 80%: At 640.65 kPa abs, the flow rate was 12,416 Nm³/h, slightly below design but sufficient for process needs, with power consumption at 1,035.4 kW, safely within motor specifications.
- Operational Efficiency: The compressor operated within its performance envelope but outside the optimal efficiency zone, leading to high power consumption and reduced pressure output.
- Motor Load: Operating at 100% IGV risked motor overload, while 80% IGV offered a safer, more efficient operating condition.
- Control Issues: Inconsistent current readings suggested potential sensor inaccuracies or control logic errors, potentially contributing to overly aggressive IGV settings.
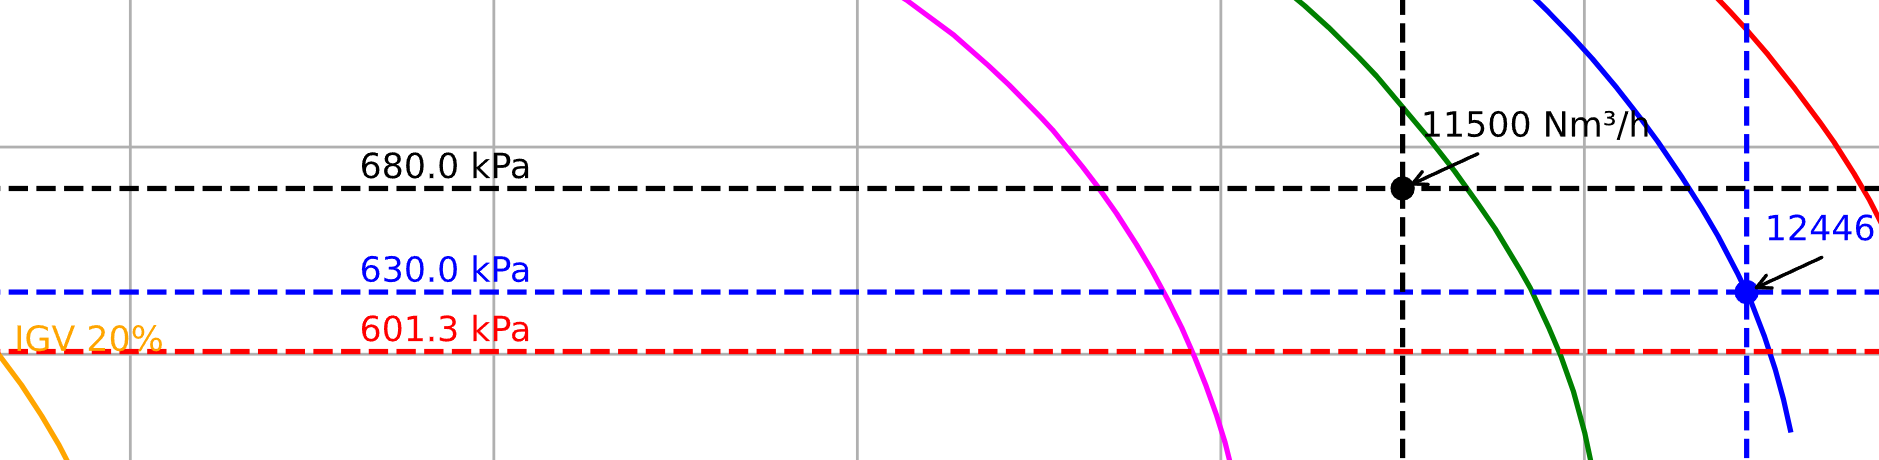
Flow vs. Discharge Pressure

Figure 1: Line chart showing inlet flow (Nm³/h) vs. discharge pressure (kPa abs) for IGV settings of 20%, 40%, 60%, 80%, and 100%. The actual operating point at 100% IGV (12,958 Nm³/h, 601.3 kPa abs) is marked with a red dot, 80% IGV (12,416 Nm³/h, 640.65 kPa abs) with a blue dot, and the design point (12,767 Nm³/h, 680 kPa abs) with a black dot. Distinct colors represent each IGV setting, with black markers for operating and design points.
This comparison clarified that the 100% IGV setting produced excessive flow without sufficient pressure—suggesting the system may be overdriving the compressor without realizing pressure gains.
Flow vs. Shaft Power

Figure 2: Line chart showing inlet flow (Nm³/h) vs. shaft power (kW) for IGV settings of 20%, 40%, 60%, 80%, and 100%. The actual operating point at 100% IGV (12,958 Nm³/h, 1,084.38 kW) is marked with a red dot, 80% IGV (12,416 Nm³/h, 1,035.4 kW) with a blue dot, and the design point (12,767 Nm³/h, 1,090 kW) with a black dot. Distinct colors represent each IGV setting, with black markers for operating and design points.
While flow exceeds specification at full IGV opening, the resulting power demand places unnecessary stress on the motor, yet fails to achieve target discharge pressure—revealing a control strategy misaligned with system needs.
Understanding the Optimal Performance Zone
Performance curves illustrate the relationship between flow, discharge pressure, and shaft power across various IGV settings. The optimal zone, centered around the design point, maximizes efficiency by achieving target pressure with minimal power consumption. Operating too far to the right (high flow, low pressure) results in:
- Increased power consumption disproportionate to pressure gains.
- Higher risk of surge or stonewall conditions, leading to compressor instability.
- Potential disruptions to downstream processes due to insufficient pressure.
- Reduced motor lifespan from continuous high-load operation.
Aligning operations with the optimal zone is critical for efficiency and equipment longevity.
Key Lessons
This case study underscores that compressor underperformance does not necessarily indicate equipment failure. Performance curves are a powerful diagnostic tool for:
- Verifying whether control systems (e.g., IGV settings) are properly configured.
- Aligning operational targets with the optimal performance zone.
- Avoiding energy waste from inefficient operation.
- Protecting motor lifespan by preventing overload.
Operators, engineers, and commissioning teams can use curve analytics to improve reliability and interpret control behavior with greater clarity.
Recommendations
To optimize compressor performance and align with process requirements, we propose the following actions:
- Validate Motor Current Sensors: Cross-check local (77 A) and main panel (97 A) readings to ensure accurate control data, addressing potential sensor inaccuracies.
- Refine IGV Control Logic: Adjust the control system to prevent overly aggressive IGV opening during load build-up, possibly due to erroneous current data.
- Test Restricted IGV Settings: Conduct trials at 85–90% IGV to evaluate improvements in discharge pressure while maintaining sufficient flow.
- Evaluate Air Intake System: Inspect cone filters and suction pipeline layouts for restrictions affecting inlet pressure.
- Check Downstream System: Confirm adequate system backpressure exists to maintain target discharge pressure.
- Align with Process Requirements: Regularly compare operating conditions with the actual process-required point (12,416 Nm³/h, 640.6 kPa abs, 1,035.4 kW) to optimize efficiency and extend motor lifespan.
- Implement Real-Time Monitoring (optional): Deploy IoT-based systems to track flow, pressure, and power in real-time.
Conclusion
Performance curves are indispensable for diagnosing centrifugal compressor issues and ensuring operational excellence. This real-world case study demonstrates that underperformance often stems from operational misalignment rather than equipment defects. By leveraging performance curves to validate operational settings, refine controls, and monitor performance, operators can achieve target pressure, reduce energy costs, and enhance equipment reliability, ultimately improving process efficiency in industrial applications.
Acknowledgments: This article is based on a real-world case study by Ketut Kumajaya at an air separation unit operated in East Java, Indonesia. Adapted for publication to highlight the diagnostic value of performance curves in compressor optimization. Annotated scripts and datasets for reproduction are available upon request.